Crossing Data Mangement:
Leveraging the FRA API
to Modernize your Systems
Follow along @:
slides.tavlasolutions.com
Today's Topics
- FRA Inventory History
- 2015 - Enter the GCIS and its API
- Are these systems used?
- What can you do?
- API use example: Crossing Viewer
FRA Inventory History
FRA 6180.71: U.S. DOT-AAR Crossing Inventory Form
Has existed since 1974, was voluntary prior to 2015
Maintained in the National Inventory File database since 1975
2015 - Enter the GCIS
and its API
safetydata.dot.fra.gov/Gcis/
Grade Crossing Inventory System
Web form, Spreadsheet upload, API
GCIS
Web Form
Must know the DOT# you want to edit
Single crossing, enter data, recieve errors, repeat
Ok for simple edits, not well suited to large updates
GCIS
Spreadsheet Upload
Not easy to auto-populate
Seems to be designed for manual data entry
Upload data, wait for processing, recieve errors, repeat
GCIS
API?
Application Programming Interface
- Application:
- A piece of software with a distinct function.
- The whole server, the whole app, or just a small part of an app.
Google Maps, NOAA weather service, your bank data
GCIS
API
Not for you, for your developers/IT department
Extensive query capabilites
Current and historical records
GCIS
API
Transmit crossing data individually or in bulk
Recieve success receipts and/or error messages
Used for integrating your in-house system with GCIS
Who uses GCIS?
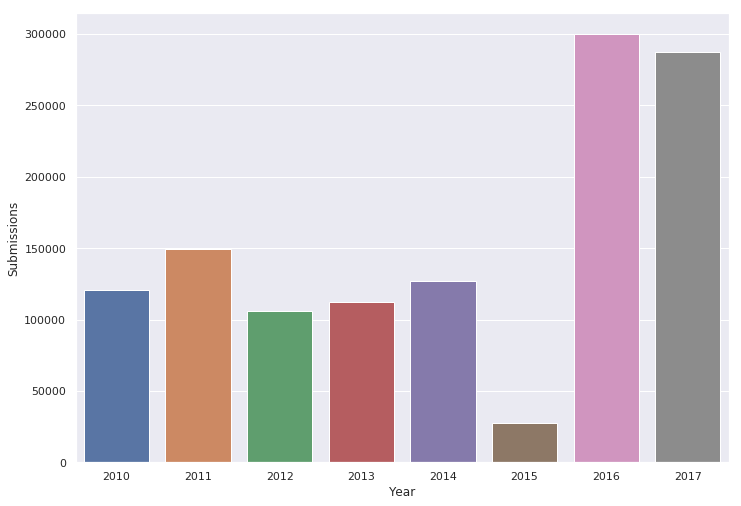
Annual Total Submissions to the National Database
Who uses GCIS?
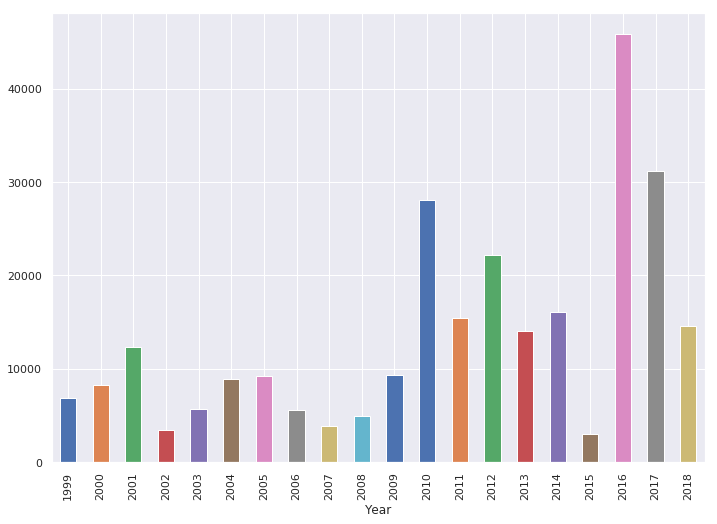
Southeastern Region Annual Total Submissions
Frequency of Updates in Alabama
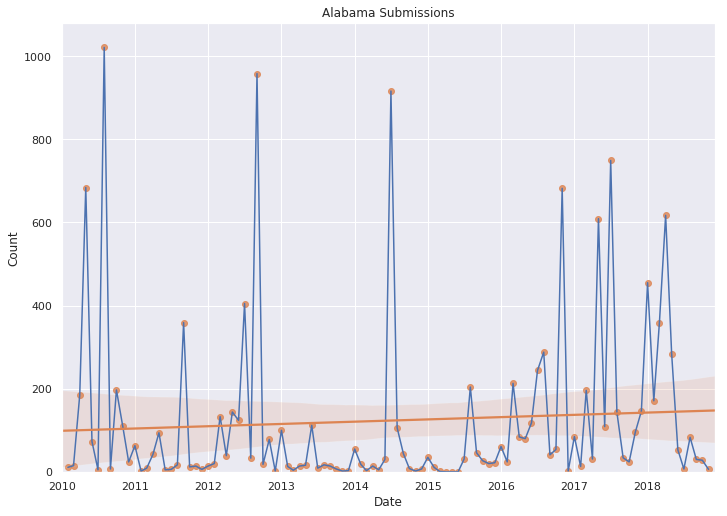
Monthly totals of RR sourced updates
Frequency of Updates in Alabama
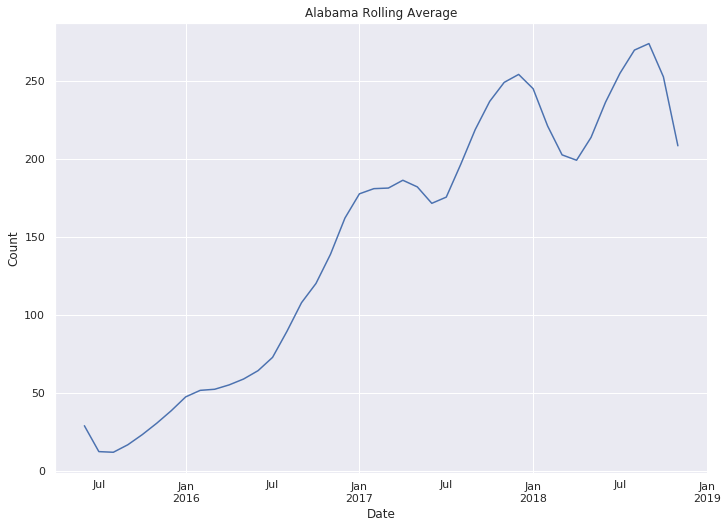
Rolling Average
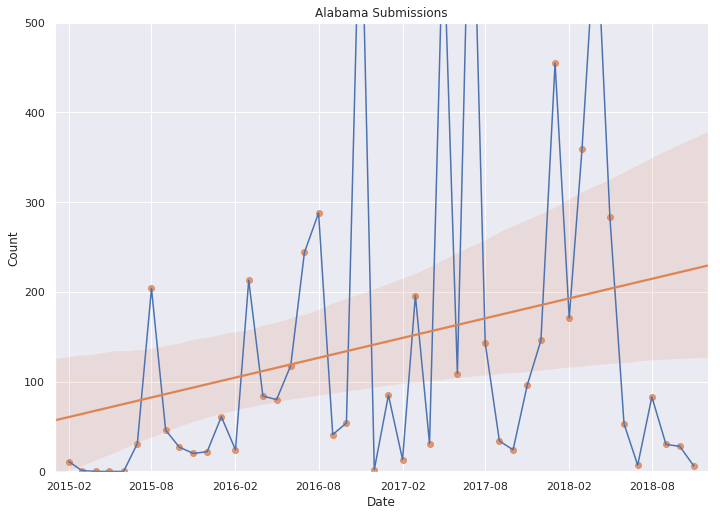
Monthly totals of RR sourced updates
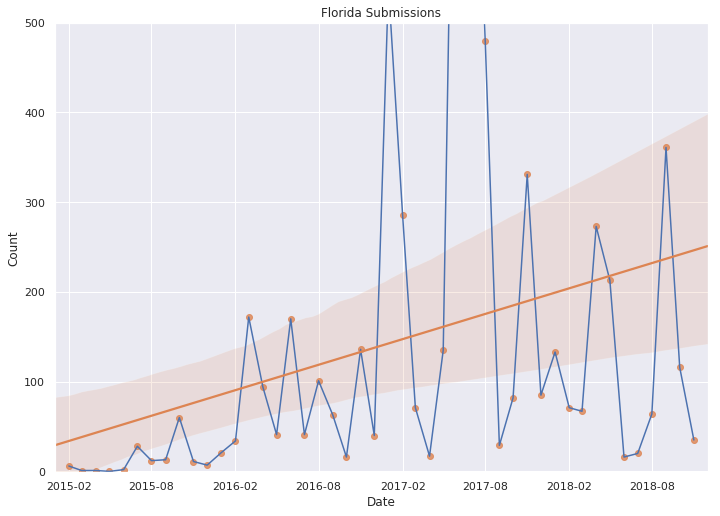
Frequency of Updates in Florida
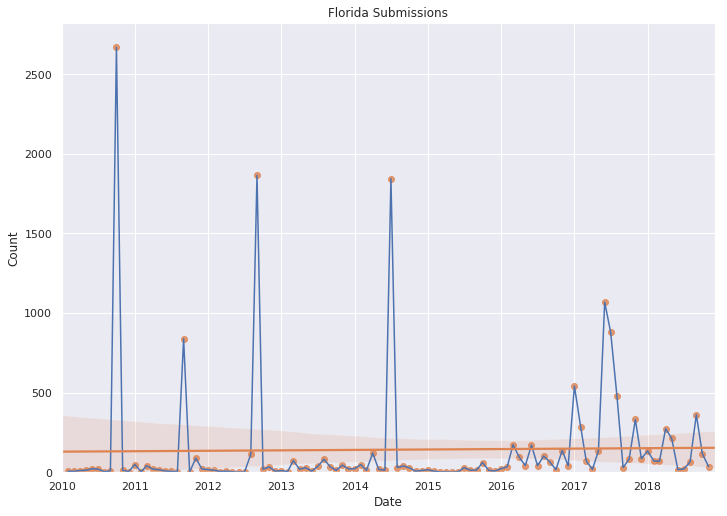
Monthly totals of RR sourced updates
Frequency of Updates in Florida
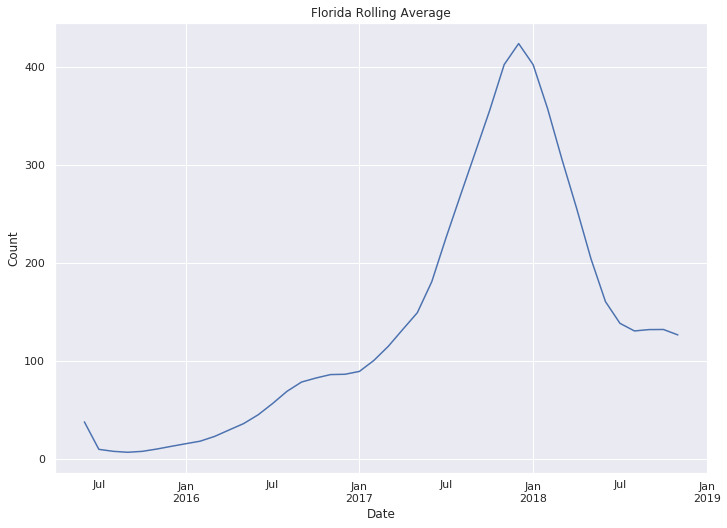
Rolling Average
Monthly totals of RR sourced updates
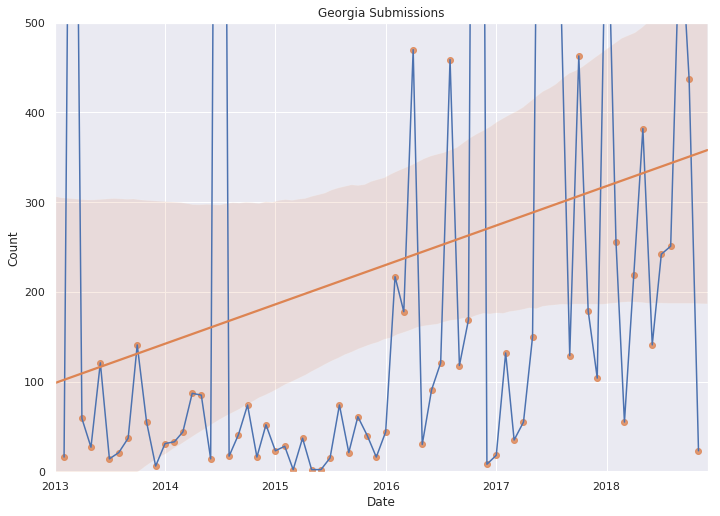
Frequency of Updates in Georgia
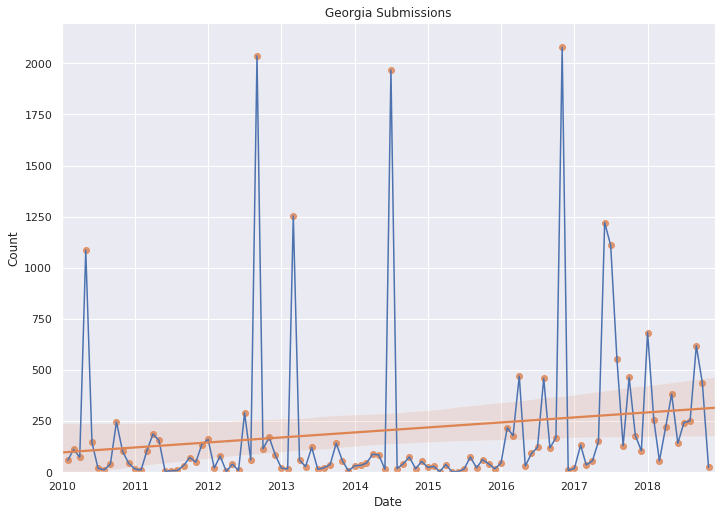
Monthly totals of RR sourced updates
Frequency of Updates in Georgia
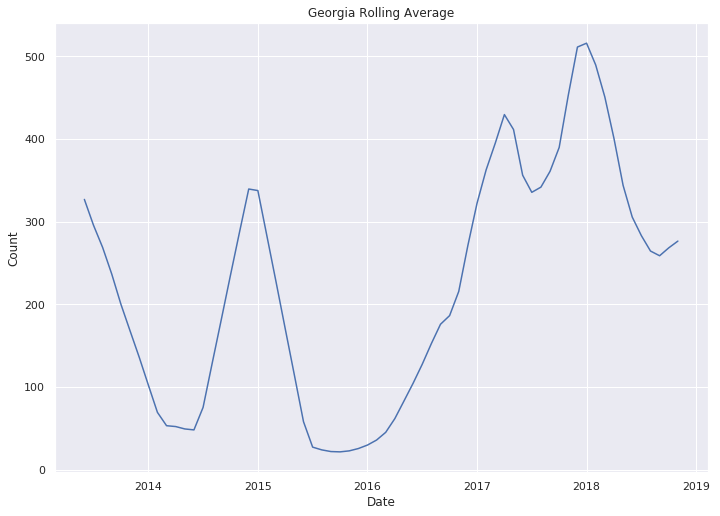
Rolling Average
Monthly totals of RR sourced updates
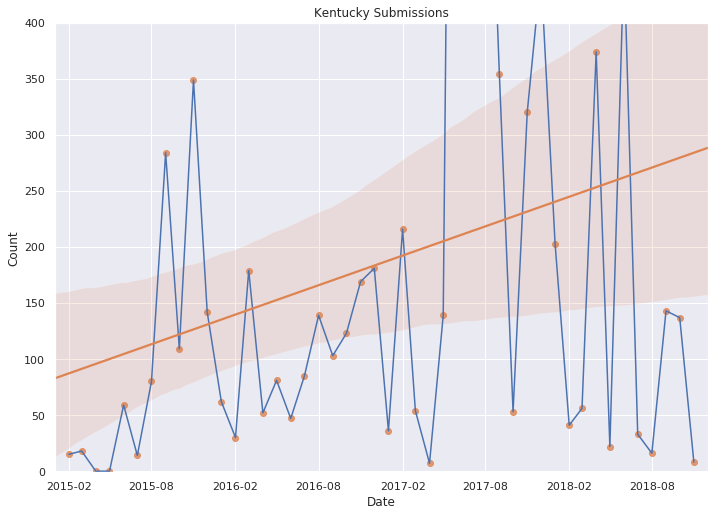
Frequency of Updates in Kentucky
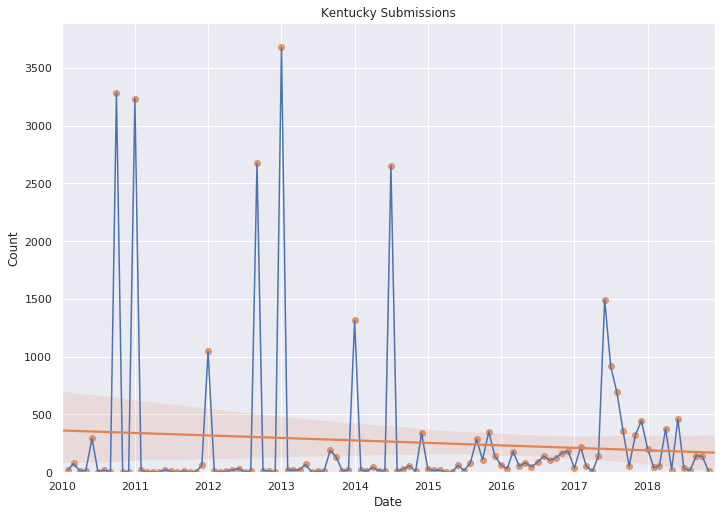
Monthly totals of RR sourced updates
Frequency of Updates in Kentucky
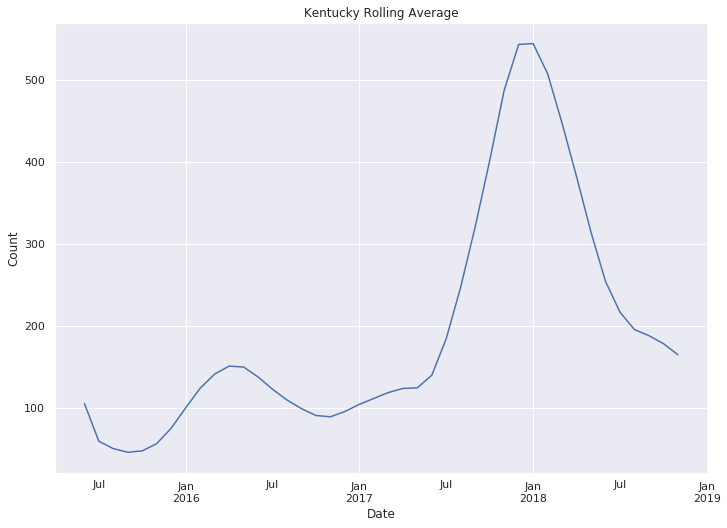
Rolling Average
Monthly totals of RR sourced updates
Frequency of Updates in Mississippi
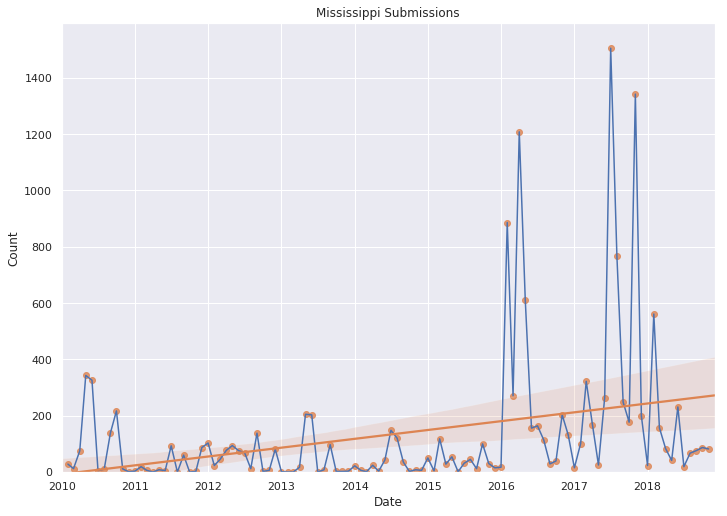
Monthly totals of RR sourced updates
Frequency of Updates in Mississippi
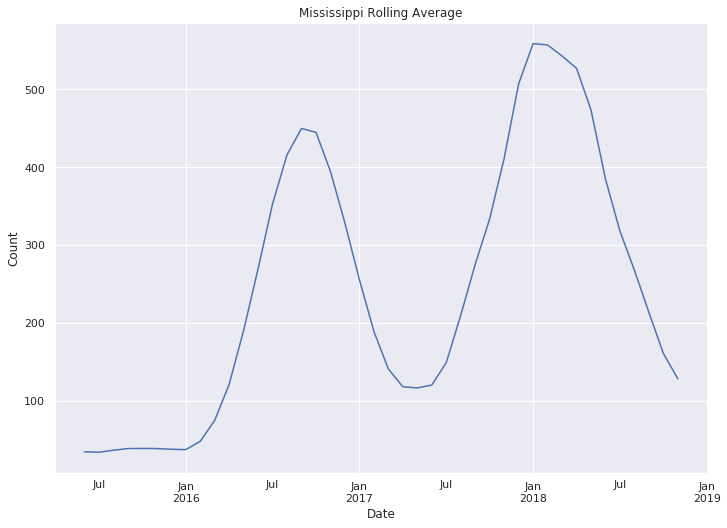
Rolling Average
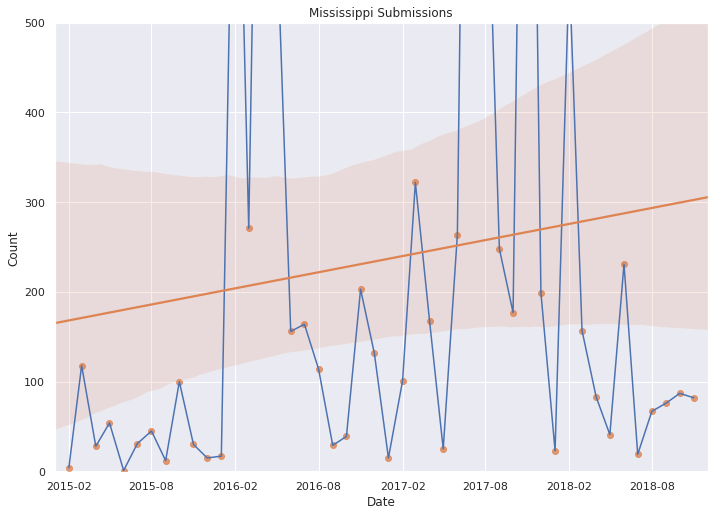
Monthly totals of RR sourced updates
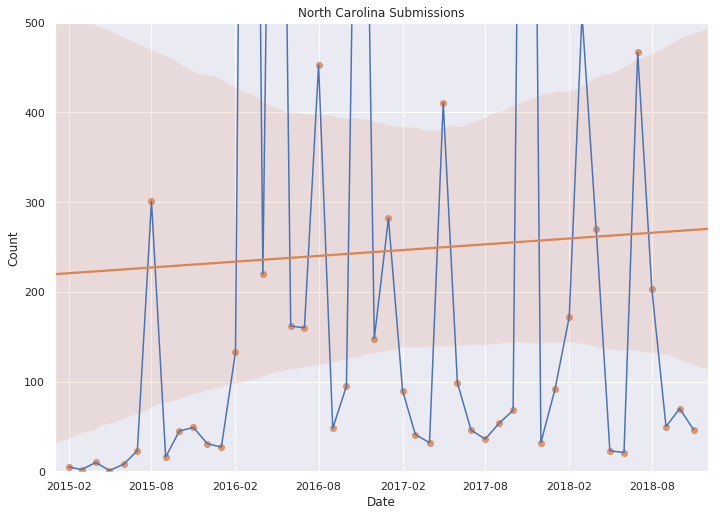
Frequency of Updates in North Carolina
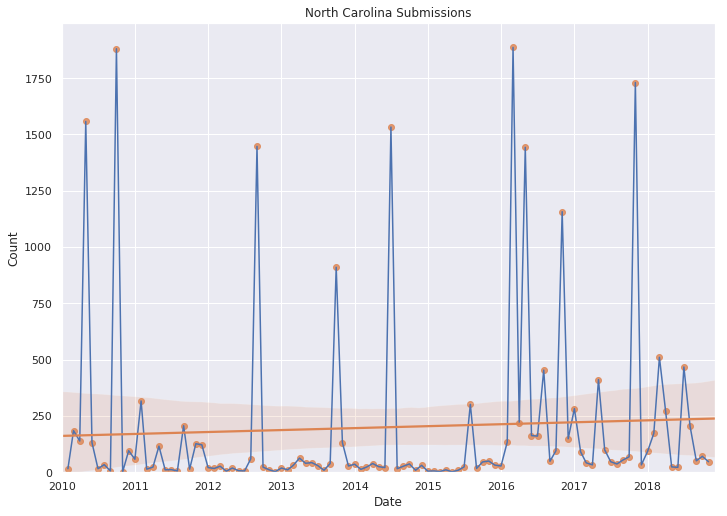
Monthly totals of RR sourced updates
Frequency of Updates in North Carolina
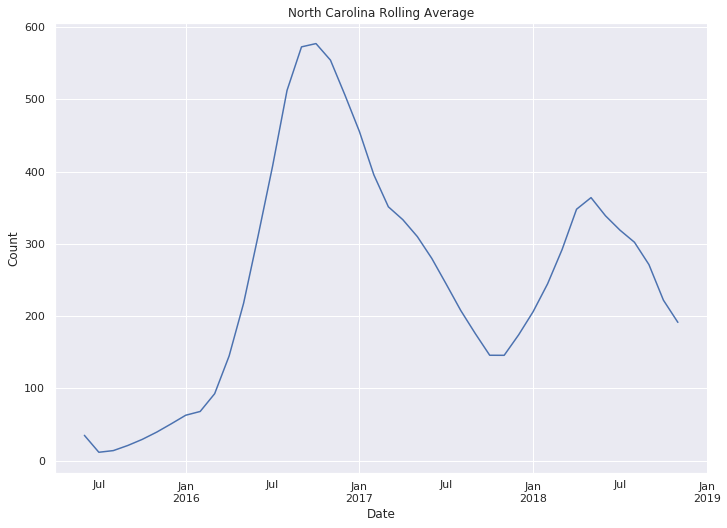
Rolling Average
Monthly totals of RR sourced updates
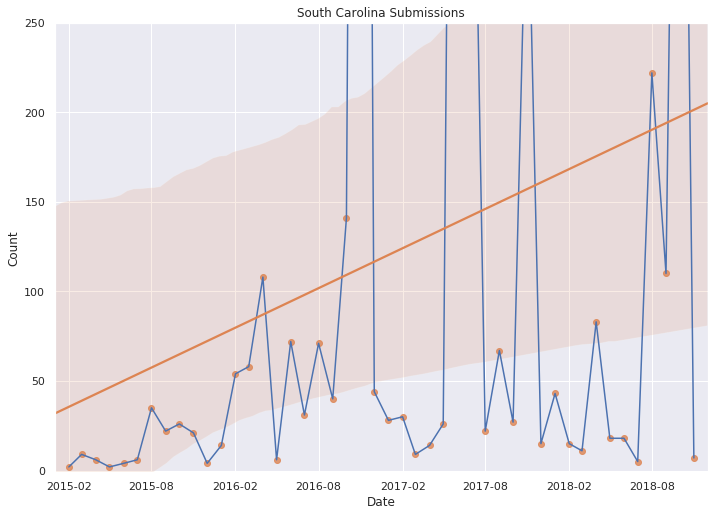
Frequency of Updates in South Carolina
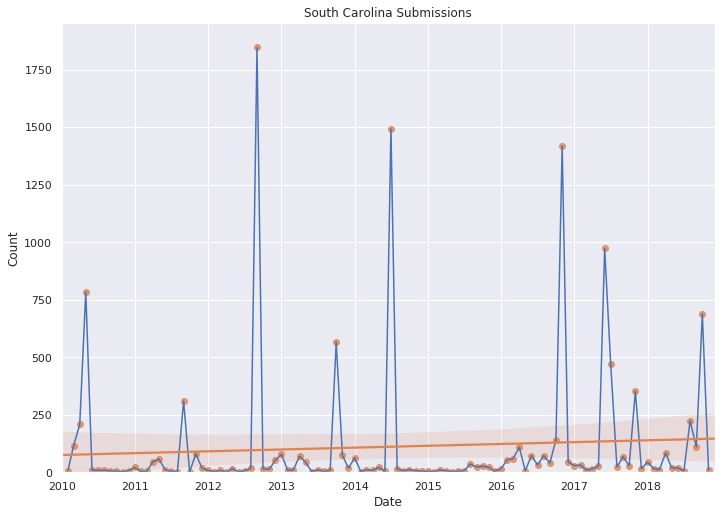
Monthly totals of RR sourced updates
Frequency of Updates in South Carolina
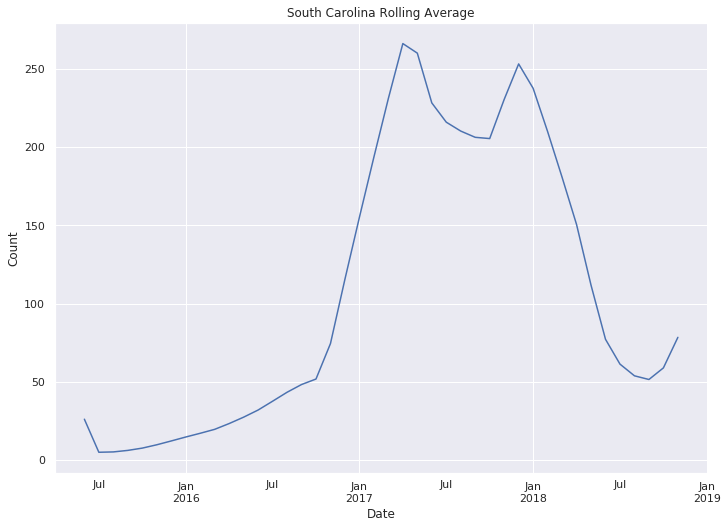
Rolling Average
Monthly totals of RR sourced updates
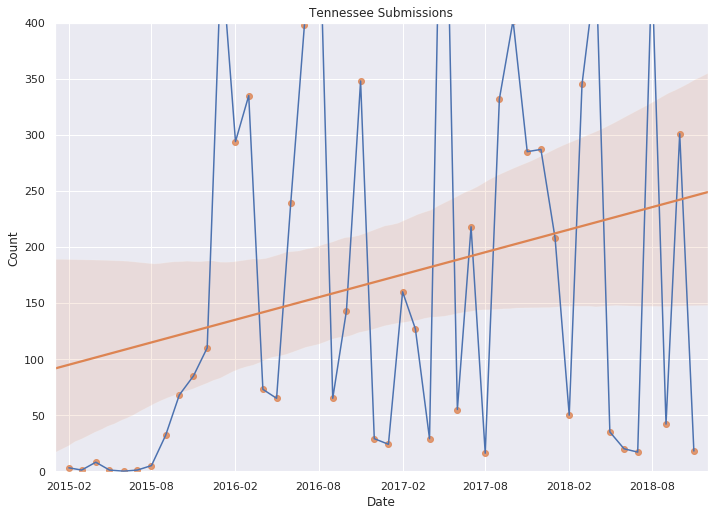
Frequency of Updates in Tennessee
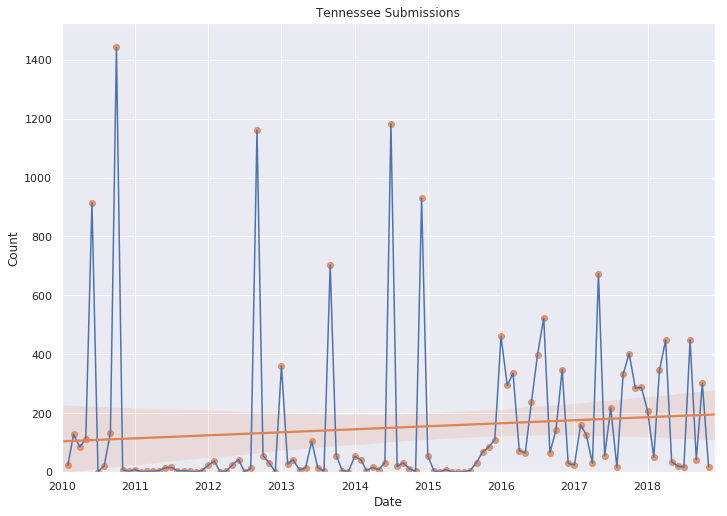
Monthly totals of RR sourced updates
Frequency of Updates in Tennessee
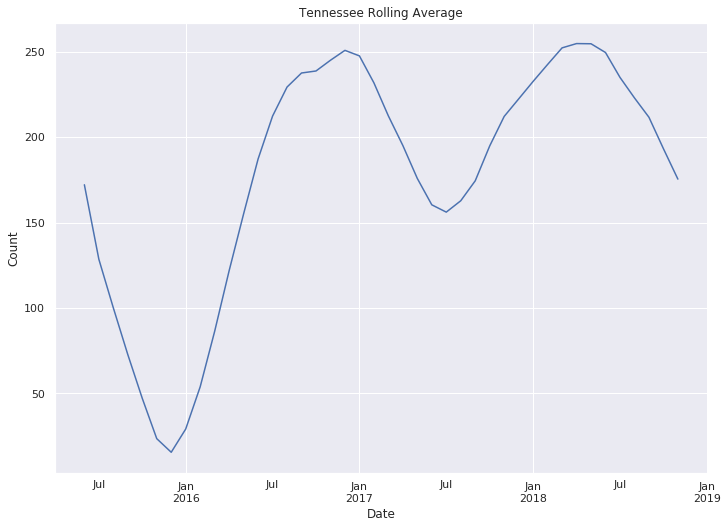
Rolling Average
Monthly totals of RR sourced updates
How we visualized the data:
import pandas as pd
import matplotlib as mpl
import matplotlib.pyplot as plt
import matplotlib.dates as mdates
import seaborn as sns

# Load the data into a frame
df = pd.read_csv('inventory_submission_data_monthly.csv')
df['Date'] = pd.to_datetime(df['Date'])
df['date_ordinal'] = pd.to_datetime(
	df['Date']).apply(lambda date: date.toordinal()
	)
yearly_df = pd.read_csv('inventory_submission_data_yearly.csv')

def get_railroad_submission_chart(state, start_date, y_limit):
	"""
	Plots the monthly railroad submission data of a given state.
	"""
	# Plot size
	sns.set(rc={'figure.figsize':(11.7,8.27)})

	# Get state data
	state_df = df[df['State'] == state]
	# Only get railroad data?
	state_df = state_df[state_df['Updating Agency'] == 'Railroad']

	state_df = state_df[state_df['Date'] > pd.Timestamp(start_date)]

	# Plot the data
	sns.lineplot(x='Date', y='Count', data=state_df)

	# Plot title
	title = state_df['State'].iloc[0] + ' Submissions'
	plt.title(title)

	plt.xlim(pd.Timestamp(start_date), pd.Timestamp('2018-12-01'))

def get_railroad_regression_chart(state, start_date, y_limit):
	"""
	Plots the monthly railroad submission data of a given state
	using a linear regression.
	"""
	# Plot size
	sns.set()

	# Get state data
	state_df = df[df['State'] == state]
	# Only get railroad data?
	state_df = state_df[state_df['Updating Agency'] == 'Railroad']

	state_df = state_df[state_df['Date'] > pd.Timestamp(start_date)]

	# Plot the data
	sns.regplot(x='date_ordinal', y='Count', data=state_df)

	# Plot title
	title = state_df['State'].iloc[0] + ' Submissions'
	plt.title(title)

	plt.xlabel('Date')
	plt.xlim(pd.Timestamp(start_date), pd.Timestamp('2018-12-01'))
	plt.ylim(-1, y_limit)

def get_moving_average(state, start_date):
	"""
	Smooths out short-term fluctuations and
	highlights longer-term trends
	"""
	state_df = df[df['State'] == state]
	rr_df = state_df[state_df['Updating Agency'] == 'Railroad']
	rr_df = rr_df[rr_df['Date'] > pd.Timestamp(start_date)]
	rr_df = rr_df.drop(
		columns=['State', 'Updating Agency', 'date_ordinal']
		)
	rr_df = rr_df.set_index('Date')
	ax = rr_df.rolling(12, win_type='triang').mean().plot(
		title = state + ' Rolling Average',
		legend = False
	)

	ax.set_ylabel("Count")
Contact us for more information.
What can you do?
Automate, automate, automate
Monitor for changes in FRA, update your in-house system
Eliminate redundant data entry!
User edits your system, automate submission to FRA
How can you do it?
- States and Railroads:
- Testing: stage.fra.dot.gov/MasterWebService/SecureAPI/
- Production: safetydata.fra.dot.gov/MasterWebService/SecureAPI/
- Everybody else:
- safetydata.fra.dot.gov/MasterWebService/PublicApi/
API use example
- Technology Demonstrator:
- Pulls data from FRA GCIS Public API
- Uses FRA crossing and/or your location data
- Integrates with Google Maps and Streetview APIs
- To create, the Crossing Trek
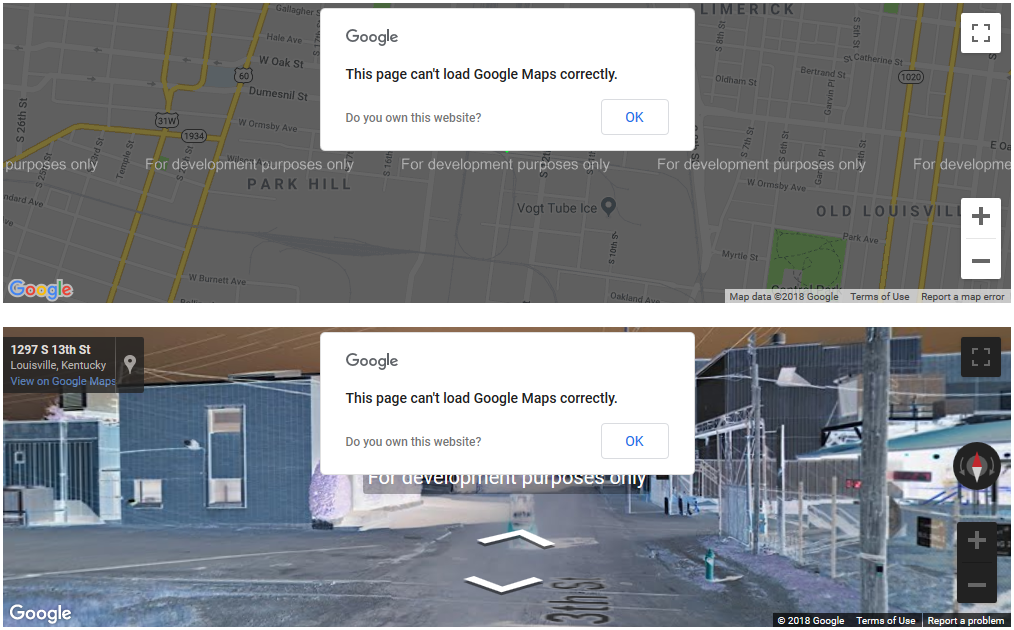
Google has eliminated their free use policy, so note that a credit card is now required to use their services in your app or website!
Other Street View Sources
www.mapillary.comCrowd sourced imagery, using computer vision to ID signs
openstreetcam.orgOpen source, crowd sourced imagery
Guess what!? They both have APIs!
Crossing Trek
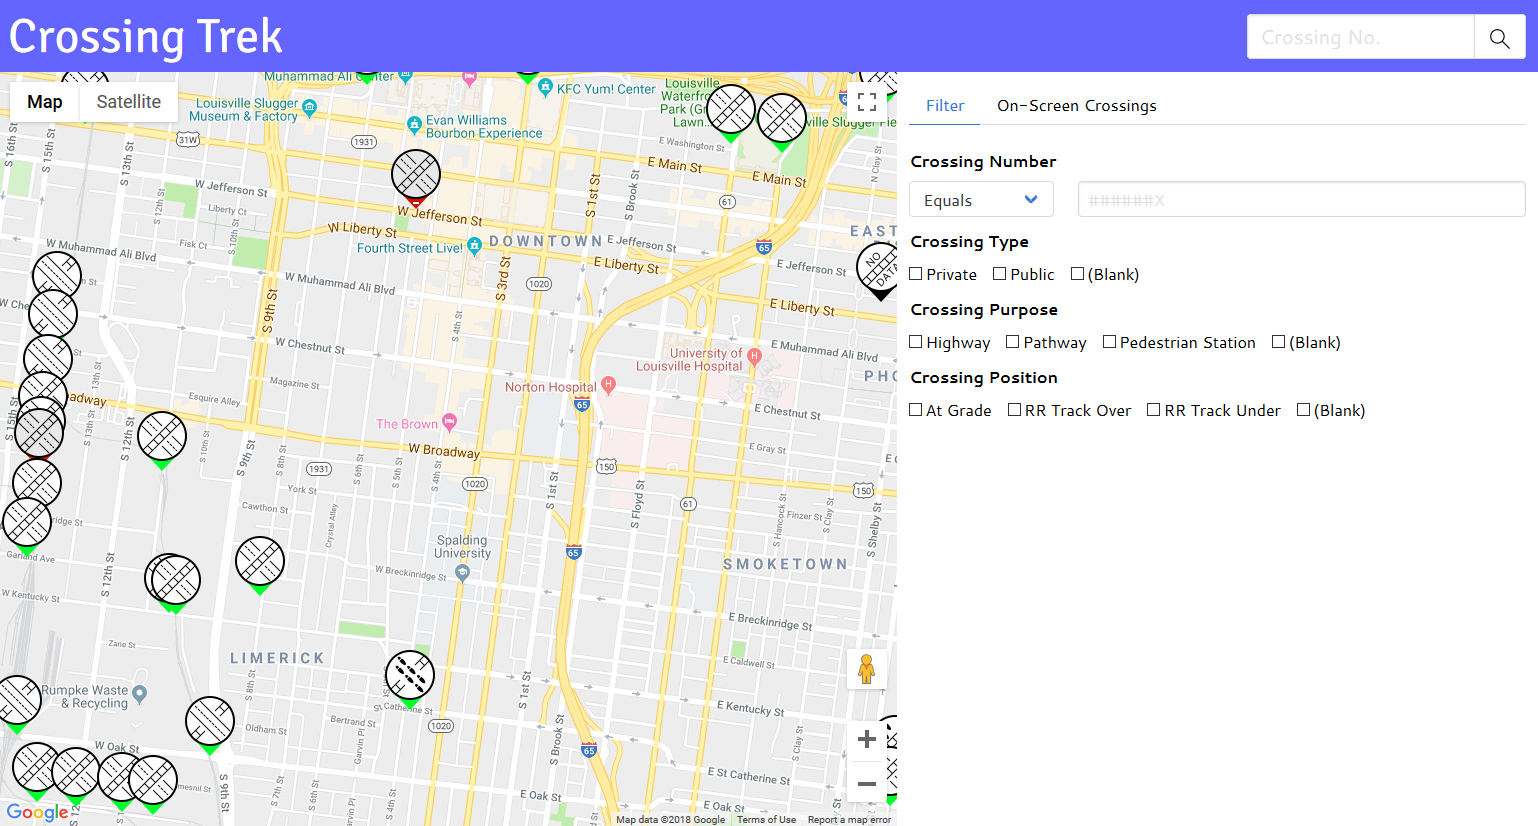
Interactive web map displaying all crossings
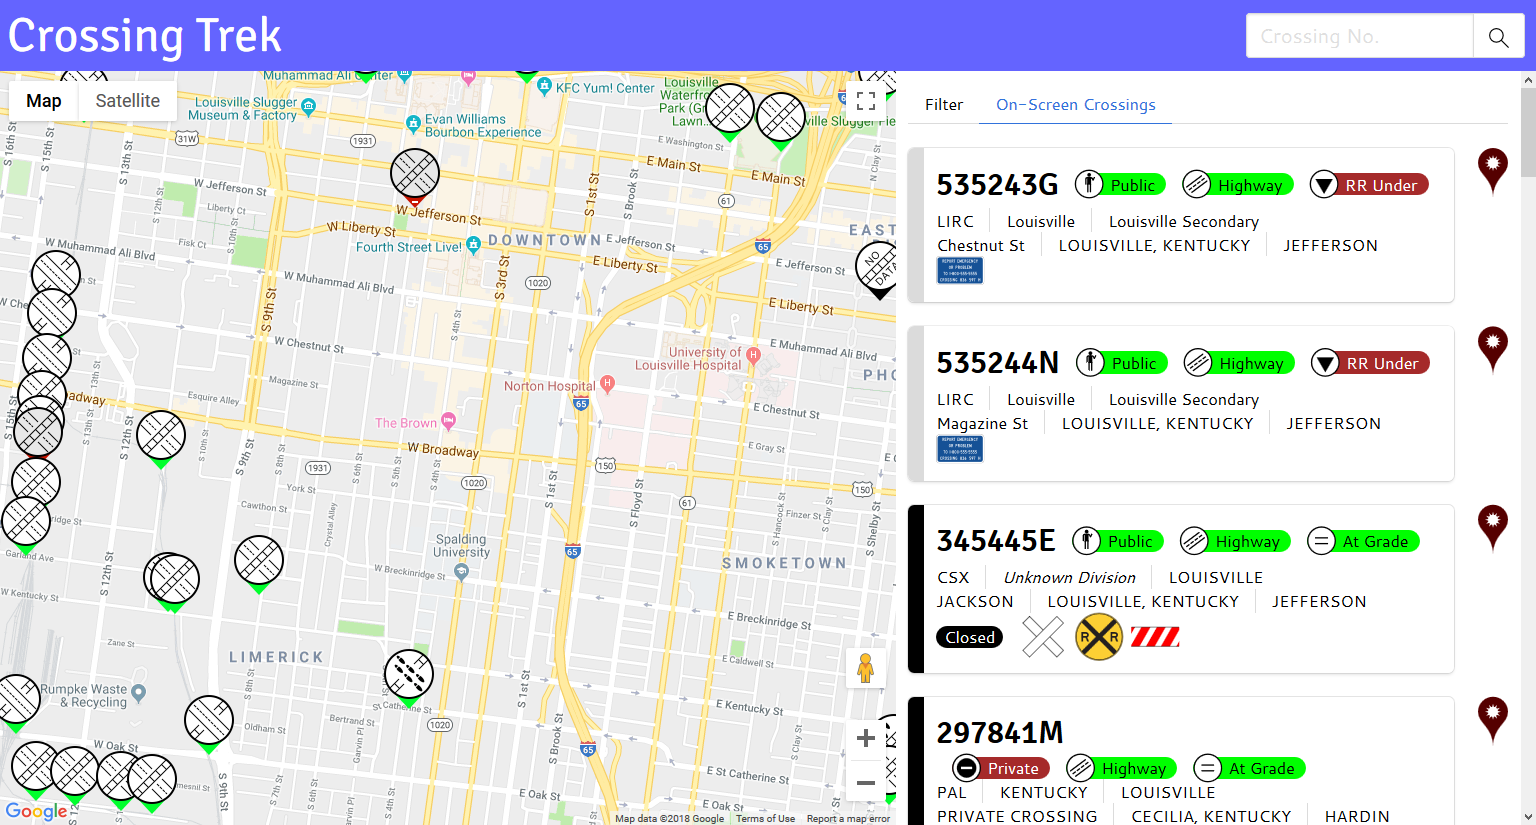
Summary info for all crossings in view
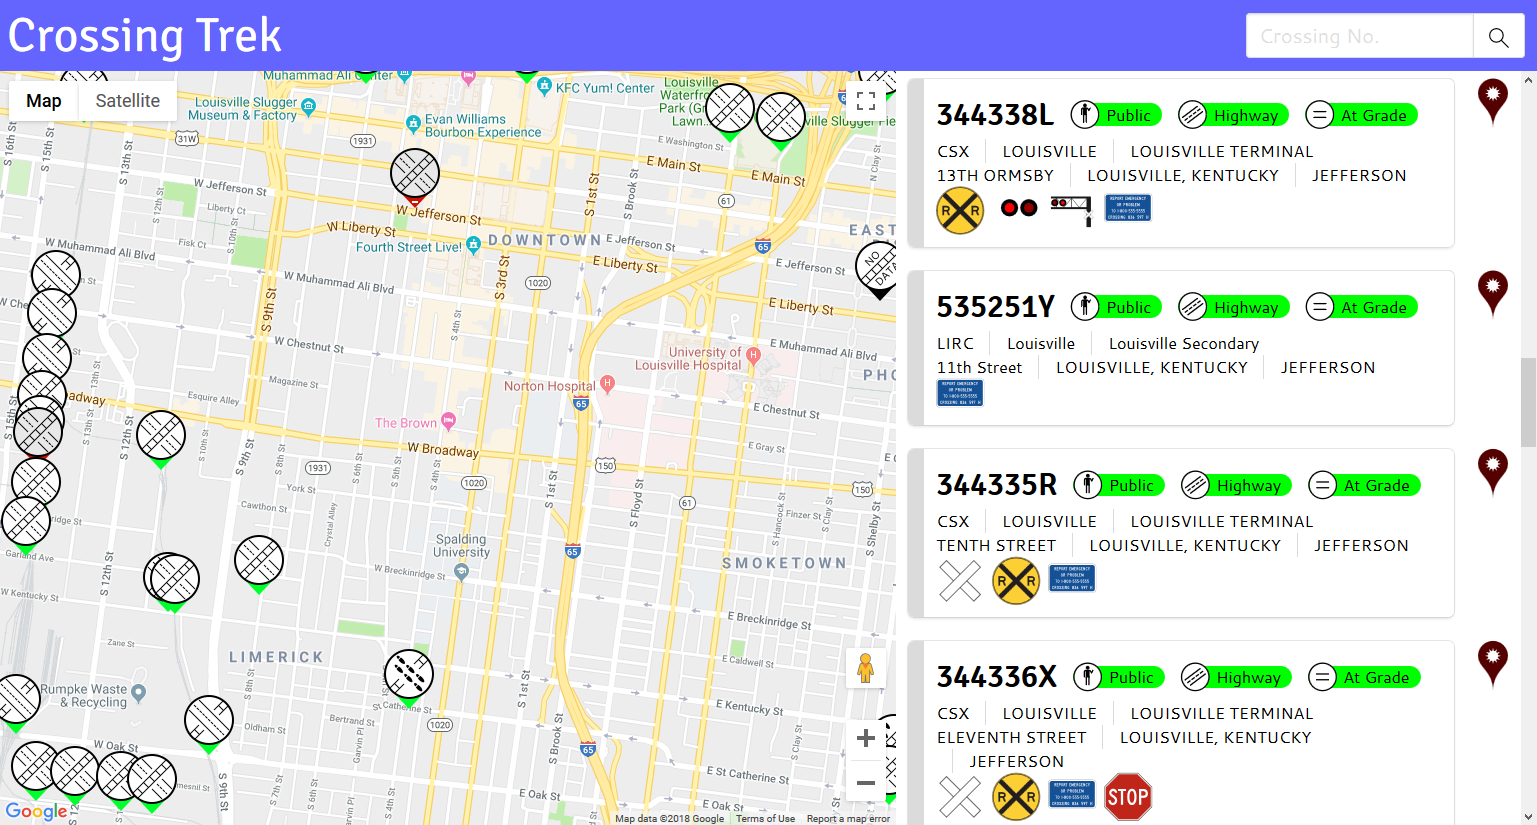
Real-time crossing data from the API tells the app which icons to display
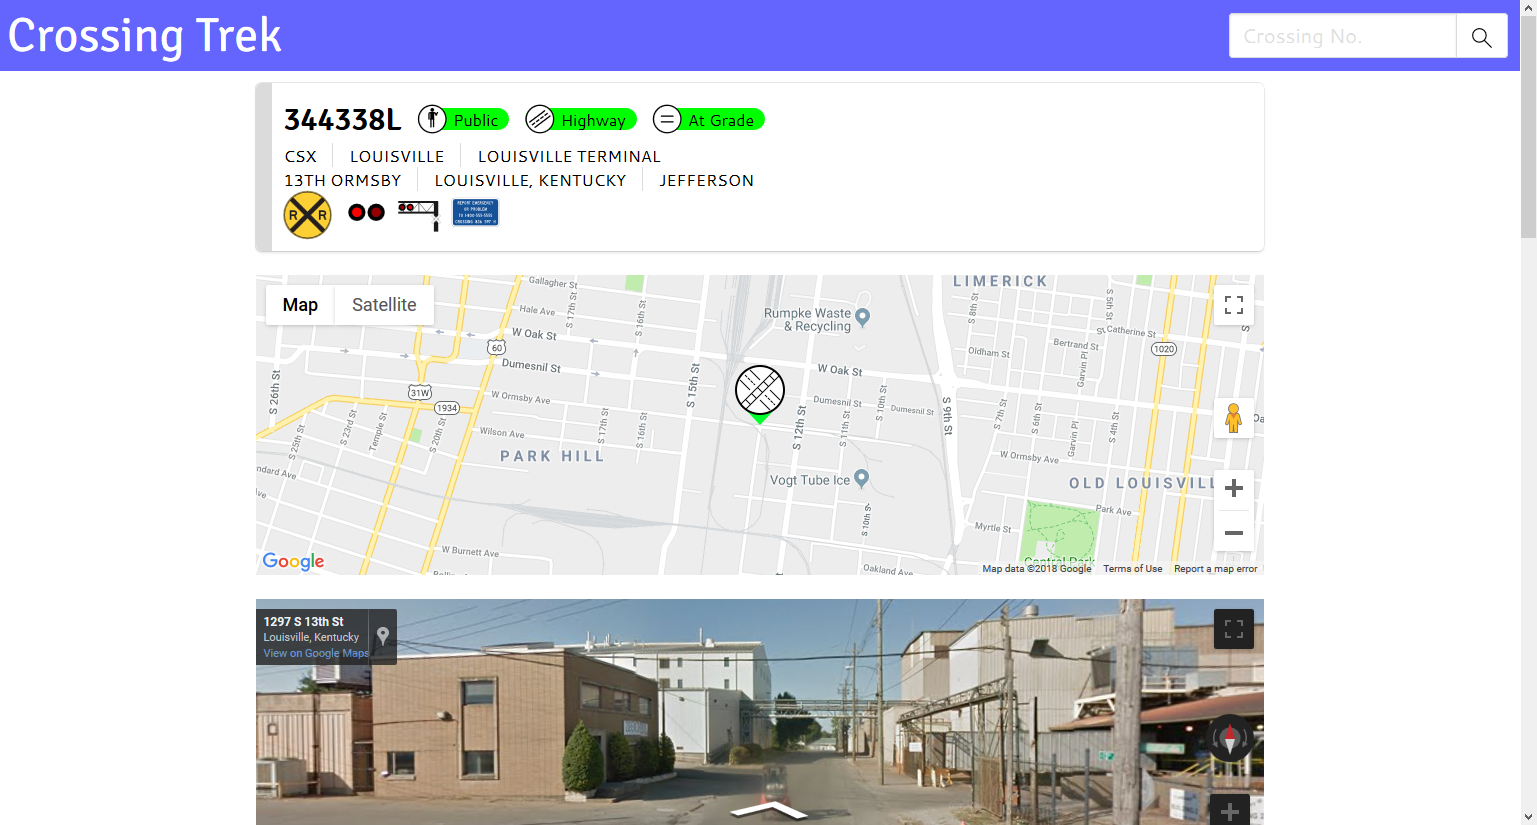
Selecting a crossing brings up a detail page with summary info, location map...
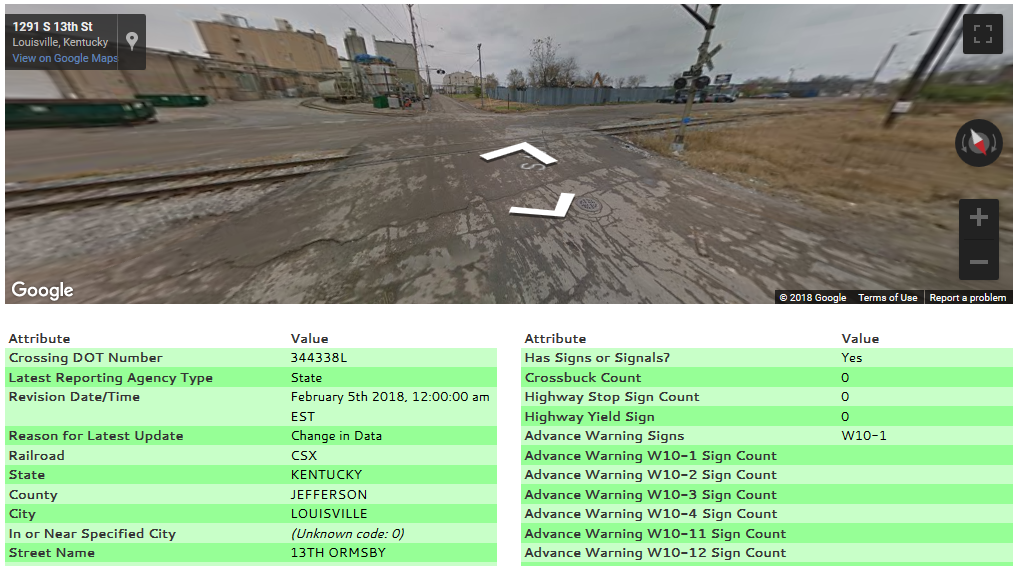
...Google Street View, and all the crossing data from GCIS
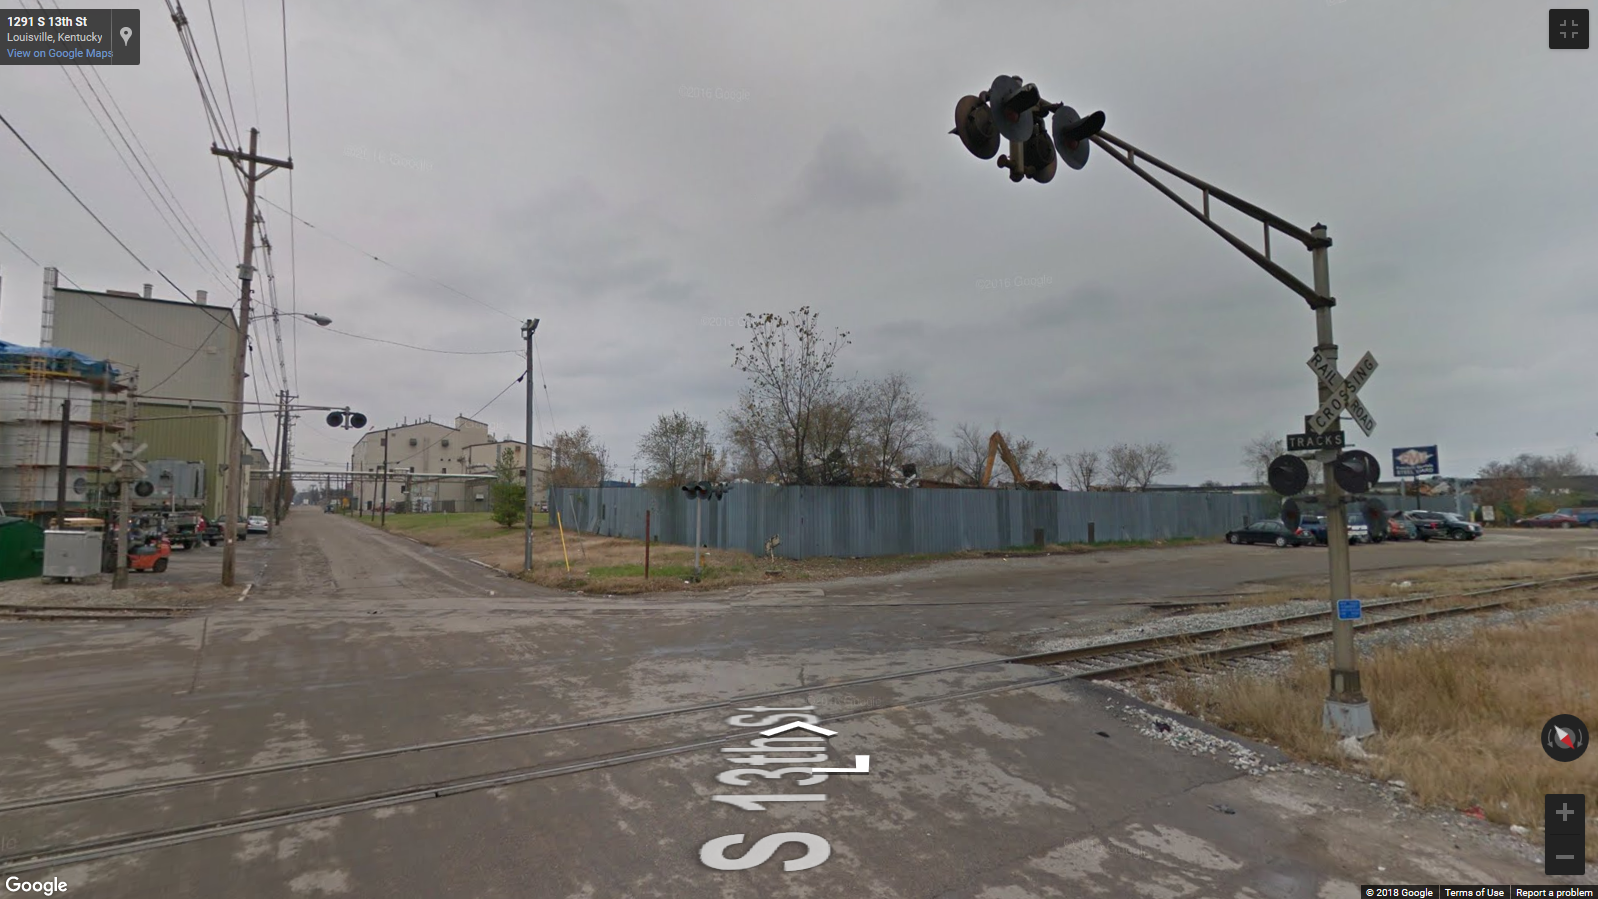
The Street View can be maximized to see crossing appurtenance details
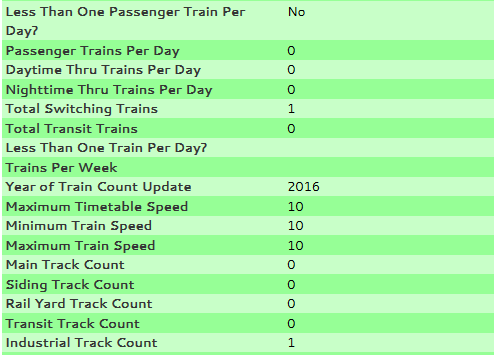
Data used in many prioritization models has been updated and is within the FRA 3 year update timeframe
Thanks for listening!
Start using the FRA API today!
- Special thanks to:
- The FRA for their API
- Nathan Wilson for the Crossing Trek
- Jon Alligood for data visualizations
- Contact us:
- rcranfill@tavlasolutions.com
- help@tavlasolutions.com
See this presentation and more at slides.tavlasolutions.com
Try the Crossing Trek technology demonstrator at map.tavlasolutions.com